Contents
- Graphik Teil I
- Einfache Kurvenplots:
- Mehrere Kurven in einer Graphik:
- Einstellungen I
- Dicke der Linien
- Groesse der Markierungen
- Art der Markierung
- Gestaltung der Markierungen
- Mehrere Plots in einem Aufruf von plot
- Farb- und Markereinstellung fuer jede Kurve
- Einstellungen II
- Beschriftung der Graphik
- Veraendern der Achsen: Skalierung und Erscheinen
- Keine Achsen
- Doch wieder Achsen
- Andere Skalierung der Achsen
- Alles wieder wie am Anfang (automatisch)
- Quadratisches Bild
- Alte Bildgroesse wiederherstellen
- Logarithmische und halblogarithmische Plots
- y-Achse logarithmisch
- Andere Arten von Plots
- Oeffnen eines neuen Graphikfensters
- Kurven im Raum
- Einzeichnen eines Gitters
- Graphen reellwertiger Funktionen in zwei Variablen
- - meshc mit Hoehenlinien (contour)
- - surf als Flaeche
Graphik Teil I
clear
close all
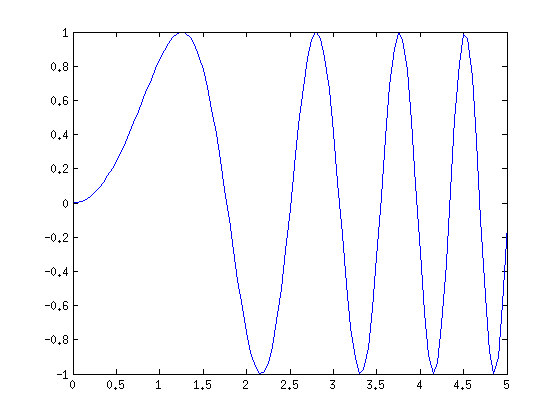
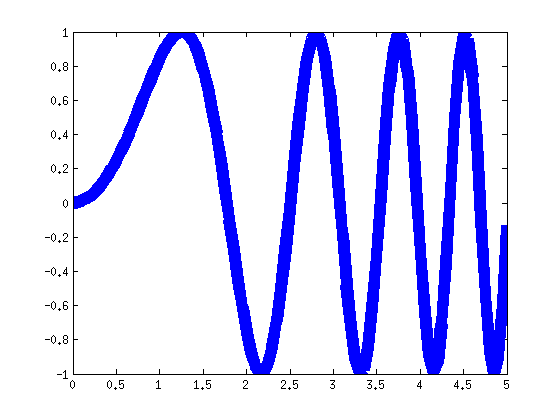
Einfache Kurvenplots:
x = 0:0.05:5;
y=sin(x.^2);
plot(x,y)

% show graph window
shg
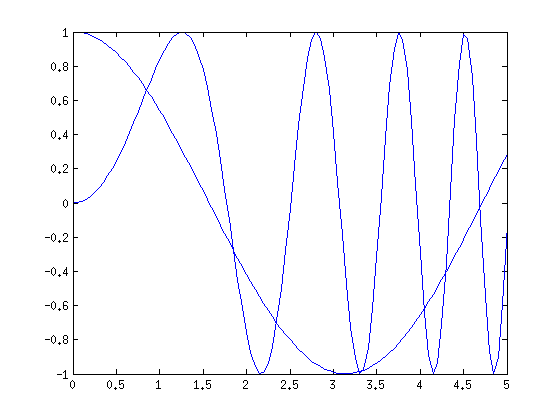
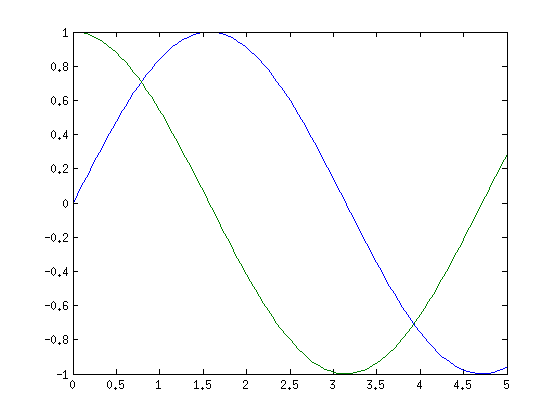
Mehrere Kurven in einer Graphik:
hold, hold on, hold off
clc
clf
plot(x,y)

% Graphik festhalten
hold on
plot(x,cos(x))

% Graphik wieder freigeben
hold off
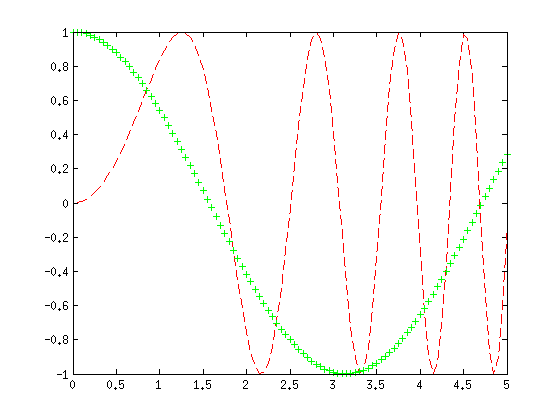
Einstellungen I
- Farbe der Linien
- Art der Linien
  . nur die Punkte einzeichnen
  . gepunktet, durchgezogen, gestrichelt
plot(x,y,'r--')
hold on
plot(x,cos(x),'g+')
hold off

clc
help plot
 PLOT   Linear plot.
    PLOT(X,Y) plots vector Y versus vector X. If X or Y is a matrix,
    then the vector is plotted versus the rows or columns of the matrix,
    whichever line up.  If X is a scalar and Y is a vector, disconnected
    line objects are created and plotted as discrete points vertically at
    X.

    PLOT(Y) plots the columns of Y versus their index.
    If Y is complex, PLOT(Y) is equivalent to PLOT(real(Y),imag(Y)).
    In all other uses of PLOT, the imaginary part is ignored.

    Various line types, plot symbols and colors may be obtained with
    PLOT(X,Y,S) where S is a character string made from one element
    from any or all the following 3 columns:

           b     blue          .     point              -     solid
           g     green         o     circle             :     dotted
           r     red           x     x-mark             -.    dashdot
           c     cyan          +     plus               --    dashed
           m     magenta       *     star             (none)  no line
           y     yellow        s     square
           k     black         d     diamond
           w     white         v     triangle (down)
                               ^     triangle (up)
                               <     triangle (left)
                               >     triangle (right)
                               p     pentagram
                               h     hexagram

    For example, PLOT(X,Y,'c+:') plots a cyan dotted line with a plus
    at each data point; PLOT(X,Y,'bd') plots blue diamond at each data
    point but does not draw any line.

    PLOT(X1,Y1,S1,X2,Y2,S2,X3,Y3,S3,...) combines the plots defined by
    the (X,Y,S) triples, where the X's and Y's are vectors or matrices
    and the S's are strings.

    For example, PLOT(X,Y,'y-',X,Y,'go') plots the data twice, with a
    solid yellow line interpolating green circles at the data points.

    The PLOT command, if no color is specified, makes automatic use of
    the colors specified by the axes ColorOrder property.  By default,
    PLOT cycles through the colors in the ColorOrder property.  For
    monochrome systems, PLOT cycles over the axes LineStyleOrder property.

    Note that RGB colors in the ColorOrder property may differ from
    similarly-named colors in the (X,Y,S) triples.  For example, the
    second axes ColorOrder property is medium green with RGB [0 .5 0],
    while PLOT(X,Y,'g') plots a green line with RGB [0 1 0].

    If you do not specify a marker type, PLOT uses no marker.
    If you do not specify a line style, PLOT uses a solid line.

    PLOT(AX,...) plots into the axes with handle AX.

    PLOT returns a column vector of handles to lineseries objects, one
    handle per plotted line.

    The X,Y pairs, or X,Y,S triples, can be followed by
    parameter/value pairs to specify additional properties
    of the lines. For example, PLOT(X,Y,'LineWidth',2,'Color',[.6 0 0])
    will create a plot with a dark red line width of 2 points.

    Example
       x = -pi:pi/10:pi;
       y = tan(sin(x)) - sin(tan(x));
       plot(x,y,'--rs','LineWidth',2,...
                       'MarkerEdgeColor','k',...
                       'MarkerFaceColor','g',...
                       'MarkerSize',10)

    See also PLOTTOOLS, SEMILOGX, SEMILOGY, LOGLOG, PLOTYY, PLOT3, GRID,
    TITLE, XLABEL, YLABEL, AXIS, AXES, HOLD, LEGEND, SUBPLOT, SCATTER.

    Overloaded methods:
       timeseries/plot
       dspdata.plot

    Reference page in Help browser
       doc plot
Dicke der Linien
plot(x,y,'LineWidth',10)
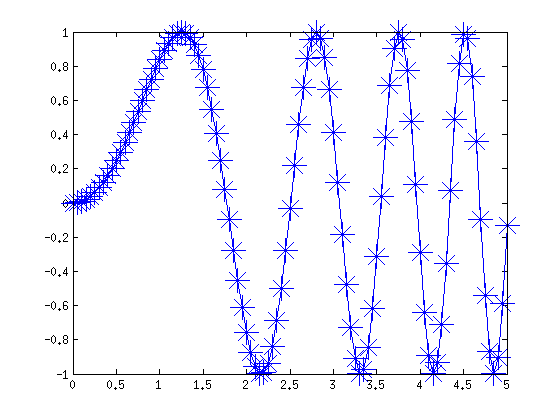
Groesse der Markierungen
plot(x,y,'*-','Markersize',20)
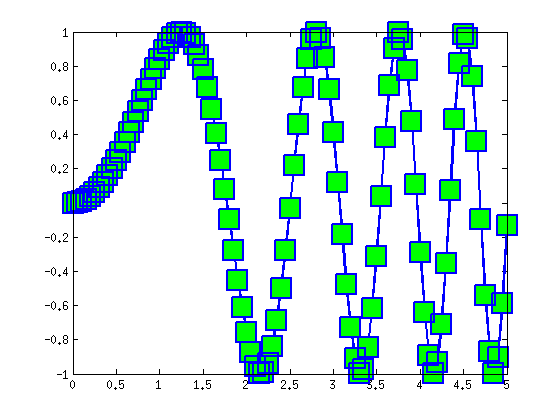
Art der Markierung
plot(x,y,'s-','Markersize',20,'LineWidth',2,'MarkerFaceColor','g')
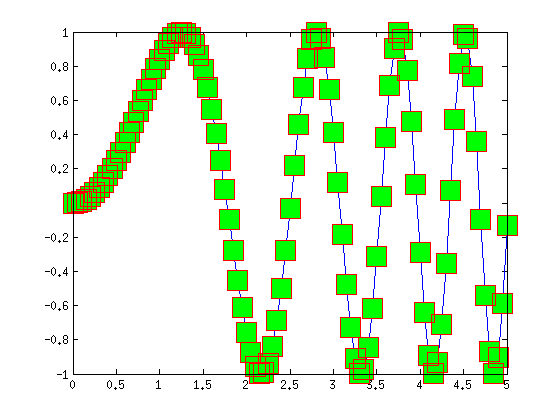
Gestaltung der Markierungen
plot(x,y,'s-','Markersize',20,'MarkerFaceColor','g','MarkerEdgeColor','r')
Mehrere Plots in einem Aufruf von plot
default: automatische Farbwahl
plot(x,sin(x),x,cos(x))
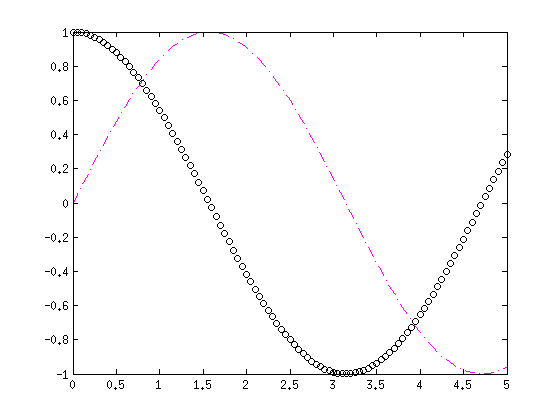
Farb- und Markereinstellung fuer jede Kurve
plot(x,sin(x),'m-.',x,cos(x),'ko')
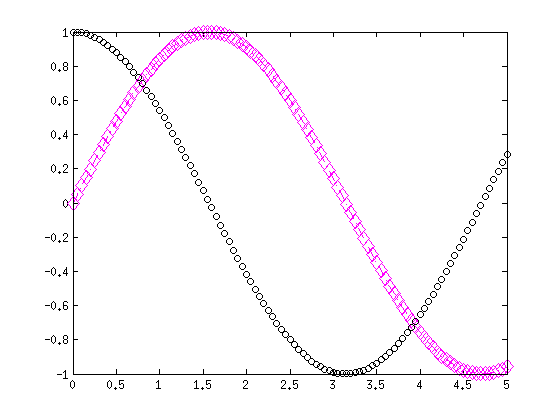
Einstellungen II
get: Anzeige der Einstellungen
h=plot(x,sin(x),'m-.',x,cos(x),'ko')
h =

  174.0076
  175.0027

get(h(1))
set(h(1),'Marker','d','MarkerSize',10)
           DisplayName: ''
            Annotation: [1x1 hg.Annotation]
                 Color: [1 0 1]
             LineStyle: '-.'
             LineWidth: 0.5000
                Marker: 'none'
            MarkerSize: 6
       MarkerEdgeColor: 'auto'
       MarkerFaceColor: 'none'
                 XData: [1x101 double]
                 YData: [1x101 double]
                 ZData: [1x0 double]
          BeingDeleted: 'off'
         ButtonDownFcn: []
              Children: [0x1 double]
              Clipping: 'on'
             CreateFcn: []
             DeleteFcn: []
            BusyAction: 'queue'
      HandleVisibility: 'on'
               HitTest: 'on'
         Interruptible: 'on'
              Selected: 'off'
    SelectionHighlight: 'on'
                   Tag: ''
                  Type: 'line'
         UIContextMenu: []
              UserData: []
               Visible: 'on'
                Parent: 173.0017
             XDataMode: 'manual'
           XDataSource: ''
           YDataSource: ''
           ZDataSource: ''
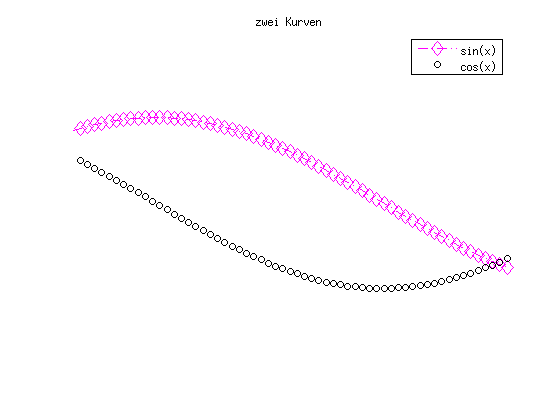
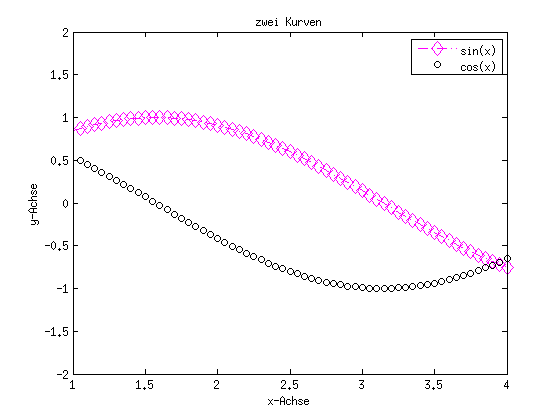
Beschriftung der Graphik
    - Ueberschrift (Titel)
    - Achsen
- Legende (ausschalten mit legend off)title('zwei Kurven') xlabel('x-Achse') ylabel('y-Achse') legend('sin(x)','cos(x)') shg

Veraendern der Achsen: Skalierung und Erscheinen
xlim([1 4])
ylim([-2 2])

Keine Achsen
axis off
shg
Doch wieder Achsen
axis on
shg
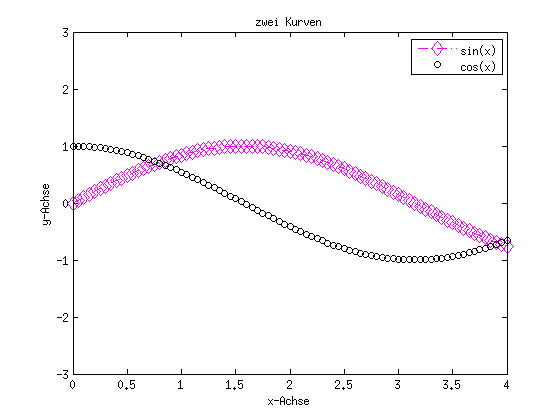
Andere Skalierung der Achsen
axis([xmin xmax ymin ymax])
axis([0 4 -3 3])
shg
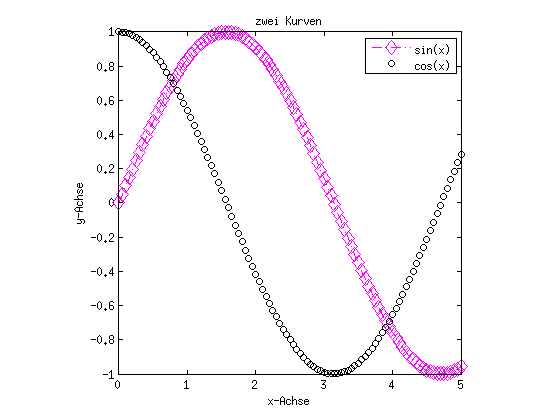
Alles wieder wie am Anfang (automatisch)
axis auto
shg

Quadratisches Bild
axis square
shg
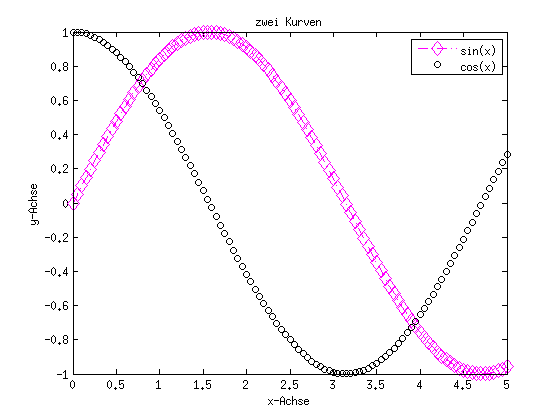
Alte Bildgroesse wiederherstellen
axis normal
shg
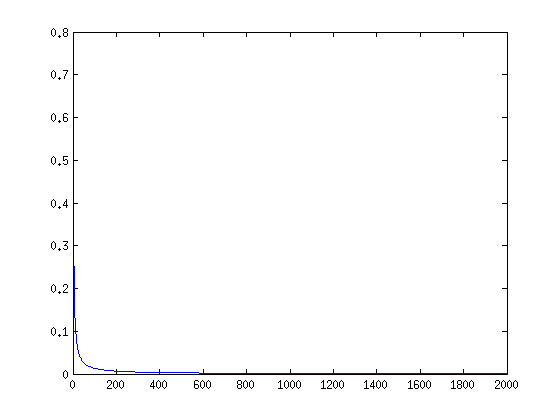
Logarithmische und halblogarithmische Plots
(Eignet sich besonders zur Darstellung von Fehlern)
semilogx, semilogy, loglog
n=1:2000;
x = (1+1./n).^n;
plot(exp(1)-x);
shg
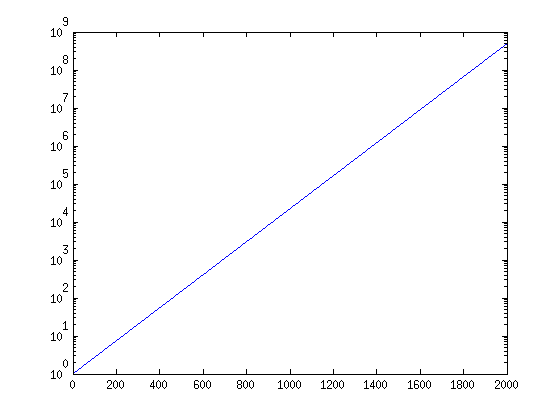
y-Achse logarithmisch
semilogy(exp(1)-x);
shg

semilogy(exp(n./100));
shg;
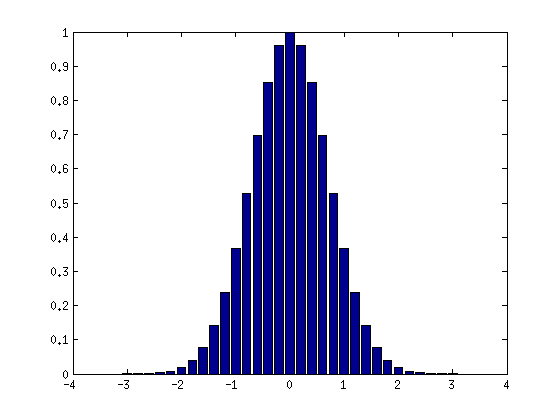
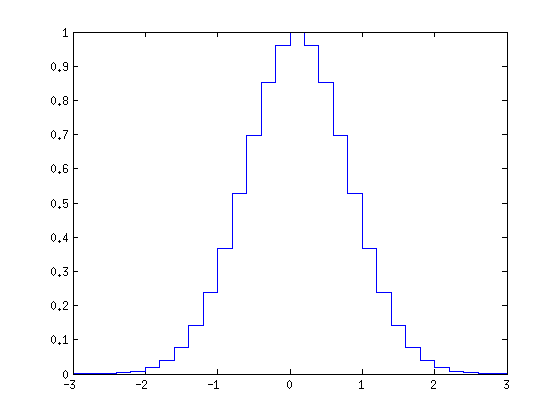
Andere Arten von Plots
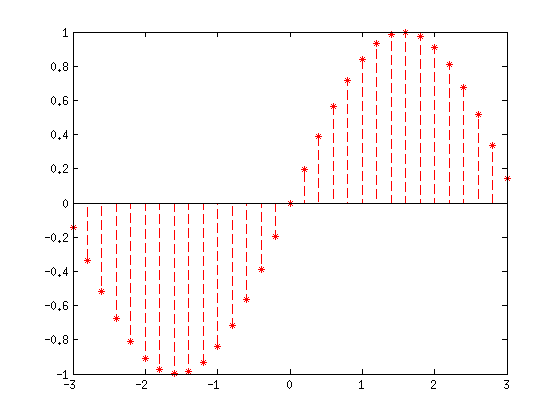
- Histogramm (bar)
- Stufenfunktion (stairs)
- stem
x = -3:0.2:3;
bar(x,exp(-x.*x));
shg
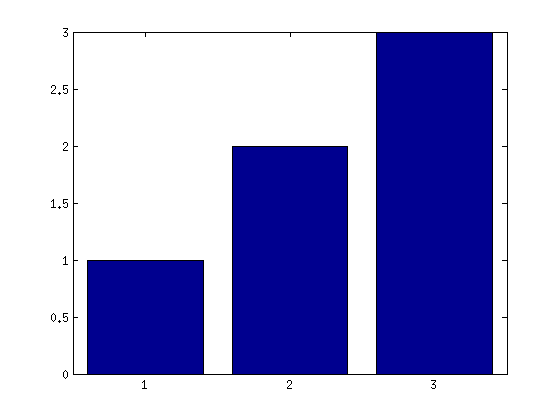
bar([1 2 3])
shg
stairs(x,exp(-x.^2))
shg
stem(x,sin(x),'*r--')
shg
Oeffnen eines neuen Graphikfensters
- Aktivieren mit figure
- Schliessen mit close
close all
figure

figure(1)
figure(2)

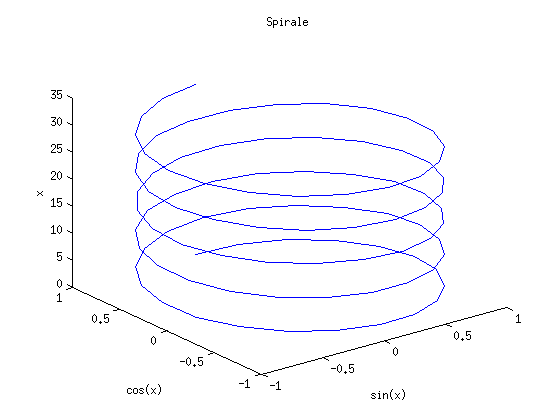
Kurven im Raum
- plot3(x(t),y(t),z(t))
- Titel und Achsenbeschriftung wie bisher
close all
x=linspace(0,10*pi);
plot3(sin(x),cos(x),x)
title('Spirale')
xlabel('sin(x)')
ylabel('cos(x)')
zlabel('x')
shg
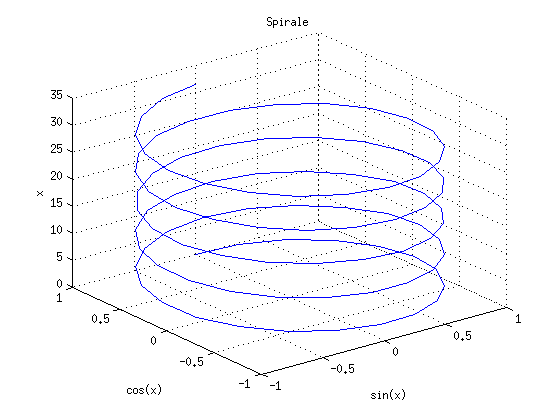
Einzeichnen eines Gitters
grid
grid on
shg
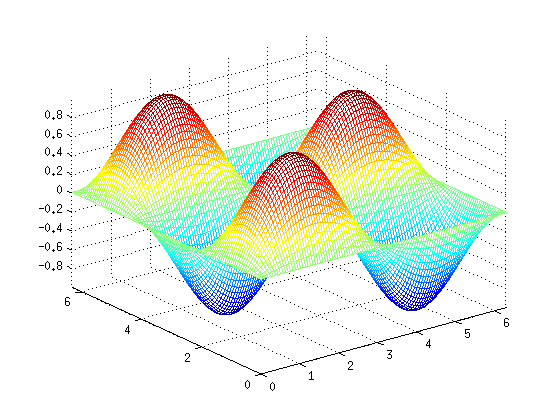
Graphen reellwertiger Funktionen in zwei Variablen
- meshgrid: 2d-Gitter erzeugen - mesh: Plot einer Funktion in zwei Variablen als Flaeche
close all
x = linspace(0,2*pi);
[X,Y] = meshgrid(x,x);
mesh(X,Y,sin(X).*sin(3/2*Y));
axis tight
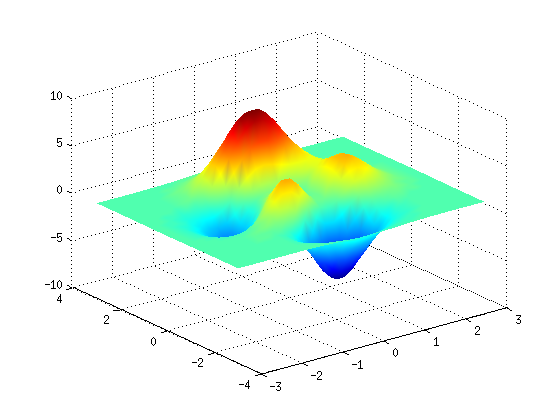
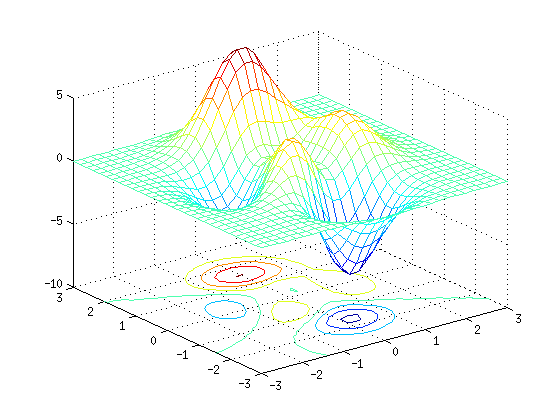
- meshc mit Hoehenlinien (contour)
figure
x = linspace(-3,3,30);
[X,Y] = meshgrid(x,x);
Z = peaks(X,Y)
meshc(X,Y,Z);
axis([-3 3 -3 3 -10 5])
Z =

  Columns 1 through 7

    0.0001    0.0002    0.0005    0.0011    0.0021    0.0036    0.0051
    0.0001    0.0004    0.0010    0.0022    0.0042    0.0070    0.0090
    0.0003    0.0007    0.0018    0.0040    0.0077    0.0125    0.0152
    0.0004    0.0012    0.0030    0.0068    0.0132    0.0212    0.0255
    0.0006    0.0018    0.0047    0.0107    0.0211    0.0348    0.0439
    0.0008    0.0023    0.0063    0.0150    0.0309    0.0542    0.0759
    0.0006    0.0023    0.0068    0.0177    0.0398    0.0767    0.1230
   -0.0001    0.0007    0.0041    0.0146    0.0400    0.0907    0.1720
   -0.0020   -0.0037   -0.0050   -0.0015    0.0175    0.0712    0.1836
   -0.0054   -0.0123   -0.0240   -0.0387   -0.0454   -0.0163    0.0956
   -0.0107   -0.0258   -0.0550   -0.1025   -0.1617   -0.2010   -0.1514
   -0.0176   -0.0435   -0.0966   -0.1906   -0.3292   -0.4840   -0.5708
   -0.0249   -0.0628   -0.1428   -0.2905   -0.5239   -0.8246   -1.1023
   -0.0315   -0.0801   -0.1844   -0.3817   -0.7048   -1.1486   -1.6241
   -0.0356   -0.0913   -0.2119   -0.4430   -0.8294   -1.3777   -2.0056
   -0.0365   -0.0940   -0.2191   -0.4611   -0.8702   -1.4618   -2.1628
   -0.0341   -0.0879   -0.2056   -0.4342   -0.8234   -1.3923   -2.0795
   -0.0290   -0.0748   -0.1753   -0.3710   -0.7053   -1.1961   -1.7935
   -0.0225   -0.0580   -0.1357   -0.2868   -0.5440   -0.9196   -1.3709
   -0.0158   -0.0405   -0.0943   -0.1978   -0.3708   -0.6156   -0.8907
   -0.0099   -0.0251   -0.0576   -0.1180   -0.2136   -0.3346   -0.4358
   -0.0054   -0.0134   -0.0295   -0.0567   -0.0919   -0.1157   -0.0777
   -0.0025   -0.0057   -0.0111   -0.0168   -0.0138    0.0230    0.1443
   -0.0008   -0.0014   -0.0012    0.0038    0.0247    0.0860    0.2336
   -0.0001    0.0004    0.0027    0.0109    0.0348    0.0949    0.2273
    0.0002    0.0009    0.0033    0.0105    0.0300    0.0760    0.1736
    0.0002    0.0007    0.0025    0.0075    0.0203    0.0500    0.1117
    0.0001    0.0005    0.0015    0.0044    0.0117    0.0282    0.0623
    0.0001    0.0002    0.0008    0.0022    0.0058    0.0139    0.0305
    0.0000    0.0001    0.0003    0.0010    0.0026    0.0061    0.0133

  Columns 8 through 14

    0.0048   -0.0001   -0.0138   -0.0403   -0.0810   -0.1328   -0.1867
    0.0066   -0.0070   -0.0413   -0.1048   -0.2005   -0.3203   -0.4438
    0.0082   -0.0225   -0.0959   -0.2294   -0.4285   -0.6762   -0.9304
    0.0120   -0.0448   -0.1792   -0.4236   -0.7885   -1.2432   -1.7107
    0.0265   -0.0579   -0.2656   -0.6510   -1.2348   -1.9710   -2.7359
    0.0678   -0.0260   -0.2873   -0.7999   -1.6039   -2.6447   -3.7511
    0.1507    0.0951   -0.1481   -0.6972   -1.6264   -2.8930   -4.2973
    0.2683    0.3210    0.2156   -0.2003   -1.0527   -2.3466   -3.8961
    0.3665    0.5892    0.7473    0.6626    0.1412   -0.9115   -2.3797
    0.3426    0.7435    1.2292    1.6107    1.6201    1.0401   -0.1335
    0.0859    0.5942    1.3611    2.2075    2.7992    2.7865    2.0214
   -0.4475    0.0383    0.9443    2.1208    3.1884    3.6812    3.3152
   -1.1808   -0.8447    0.0357    1.3544    2.7132    3.5628    3.5133
   -1.9334   -1.8128   -1.0692    0.2400    1.7220    2.7820    2.9609
   -2.5071   -2.5904   -2.0188   -0.8052    0.6816    1.8399    2.1781
   -2.7738   -3.0004   -2.5885   -1.5183   -0.1189    1.0384    1.4687
   -2.7057   -2.9988   -2.7148   -1.8156   -0.5797    0.4866    0.9412
   -2.3465   -2.6227   -2.4086   -1.6612   -0.6045    0.3390    0.7905
   -1.7748   -1.9423   -1.6987   -1.0049   -0.0381    0.8578    1.3601
   -1.0925   -1.0676   -0.6762    0.1126    1.1530    2.1536    2.8183
   -0.4234   -0.1677    0.4461    1.4397    2.6829    3.9088    4.8184
    0.1104    0.5630    1.3772    2.5671    4.0104    5.4514    6.5803
    0.4318    0.9854    1.8871    3.1456    4.6481    6.1568    7.3687
    0.5368    1.0780    1.9231    3.0769    4.4437    5.8198    6.9384
    0.4848    0.9293    1.6095    2.5280    3.6115    4.7038    5.5970
    0.3589    0.6732    1.1492    1.7880    2.5400    3.2986    3.9209
    0.2272    0.4214    0.7136    1.1046    1.5643    2.0281    2.4093
    0.1255    0.2313    0.3900    0.6018    0.8506    1.1018    1.3085
    0.0612    0.1124    0.1890    0.2911    0.4110    0.5321    0.6317
    0.0266    0.0487    0.0817    0.1257    0.1773    0.2294    0.2724

  Columns 15 through 21

   -0.2305   -0.2530   -0.2487   -0.2197   -0.1749   -0.1256   -0.0814
   -0.5430   -0.5925   -0.5798   -0.5107   -0.4057   -0.2910   -0.1885
   -1.1333   -1.2329   -1.2041   -1.0589   -0.8401   -0.6017   -0.3891
   -2.0850   -2.2694   -2.2169   -1.9493   -1.5452   -1.1049   -0.7124
   -3.3558   -3.6695   -3.5953   -3.1657   -2.5085   -1.7893   -1.1480
   -4.6709   -5.1615   -5.0918   -4.4986   -3.5643   -2.5320   -1.6097
   -5.5172   -6.2233   -6.2193   -5.5297   -4.3799   -3.0866   -1.9274
   -5.3419   -6.2781   -6.4300   -5.7811   -4.5699   -3.1647   -1.8998
   -3.9164   -5.0621   -5.4543   -5.0035   -3.9222   -2.5982   -1.4021
   -1.6129   -2.9103   -3.5717   -3.4106   -2.5850   -1.4782   -0.4824
    0.7066   -0.6573   -1.5285   -1.6191   -1.0287   -0.1365    0.6431
    2.2094    0.8718   -0.0779   -0.2676    0.2405    1.0500    1.7098
    2.6164    1.3857    0.4997    0.3861    0.9903    1.8763    2.5439
    2.2606    1.1913    0.4619    0.5250    1.3157    2.3552    3.0989
    1.6616    0.7785    0.2316    0.4709    1.4191    2.5762    3.3801
    1.1137    0.4169    0.0352    0.3899    1.3988    2.5754    3.3778
    0.7154    0.1888   -0.0633    0.3286    1.2870    2.3745    3.1064
    0.6760    0.2953    0.1175    0.4494    1.2322    2.1103    2.6883
    1.3773    1.1151    0.9283    1.0678    1.5175    2.0354    2.3418
    3.0144    2.8433    2.5533    2.3612    2.3208    2.3291    2.2387
    5.2205    5.1155    4.6636    4.0693    3.4713    2.9093    2.3658
    7.1545    7.0943    6.4948    5.5574    4.4929    3.4562    2.5336
    8.0208    7.9887    7.3243    6.2186    4.9170    3.6374    2.5251
    7.5556    7.5397    6.9168    5.8522    4.5806    3.3261    2.2456
    6.0961    6.0888    5.5873    4.7191    3.6752    2.6436    1.7590
    4.2709    4.2678    3.9169    3.3052    2.5672    1.8373    1.2128
    2.6245    2.6233    2.4078    2.0307    1.5749    1.1239    0.7385
    1.4254    1.4249    1.3079    1.1028    0.8545    0.6087    0.3989
    0.6882    0.6880    0.6315    0.5324    0.4123    0.2934    0.1919
    0.2967    0.2967    0.2723    0.2295    0.1777    0.1264    0.0826

  Columns 22 through 28

   -0.0476   -0.0251   -0.0119   -0.0050   -0.0019   -0.0006   -0.0002
   -0.1102   -0.0580   -0.0275   -0.0116   -0.0044   -0.0014   -0.0004
   -0.2270   -0.1192   -0.0562   -0.0236   -0.0088   -0.0028   -0.0008
   -0.4137   -0.2158   -0.1006   -0.0417   -0.0151   -0.0047   -0.0012
   -0.6610   -0.3402   -0.1555   -0.0623   -0.0214   -0.0060   -0.0011
   -0.9122   -0.4574   -0.2002   -0.0745   -0.0221   -0.0041    0.0004
   -1.0573   -0.5009   -0.1976   -0.0587   -0.0077    0.0051    0.0053
   -0.9650   -0.3907   -0.1019    0.0094    0.0337    0.0272    0.0157
   -0.5488   -0.0706    0.1207    0.1485    0.1119    0.0666    0.0336
    0.1716    0.4548    0.4720    0.3620    0.2294    0.1251    0.0600
    1.0658    1.1130    0.9147    0.6322    0.3785    0.1995    0.0935
    1.9588    1.7951    1.3854    0.9246    0.5420    0.2818    0.1309
    2.7119    2.3990    1.8156    1.1976    0.6968    0.3606    0.1670
    3.2506    2.8488    2.1438    1.4091    0.8180    0.4227    0.1956
    3.5324    3.0871    2.3188    1.5221    0.8830    0.4561    0.2109
    3.5236    3.0747    2.3069    1.5132    0.8774    0.4531    0.2095
    3.2333    2.8172    2.1116    1.3842    0.8022    0.4142    0.1915
    2.7643    2.3932    1.7871    1.1689    0.6764    0.3489    0.1612
    2.2939    1.9353    1.4238    0.9227    0.5308    0.2727    0.1256
    1.9727    1.5624    1.1054    0.6986    0.3952    0.2007    0.0917
    1.8280    1.3159    0.8703    0.5245    0.2869    0.1422    0.0638
    1.7626    1.1545    0.7058    0.3994    0.2080    0.0992    0.0433
    1.6462    1.0065    0.5753    0.3062    0.1511    0.0689    0.0289
    1.4118    0.8270    0.4511    0.2289    0.1079    0.0471    0.0190
    1.0840    0.6192    0.3280    0.1611    0.0734    0.0309    0.0121
    0.7390    0.4160    0.2165    0.1041    0.0463    0.0190    0.0072
    0.4471    0.2495    0.1284    0.0610    0.0267    0.0108    0.0040
    0.2405    0.1335    0.0682    0.0321    0.0139    0.0056    0.0021
    0.1154    0.0639    0.0325    0.0152    0.0066    0.0026    0.0010
    0.0496    0.0274    0.0139    0.0065    0.0028    0.0011    0.0004

  Columns 29 through 30

   -0.0000   -0.0000
   -0.0001   -0.0000
   -0.0002   -0.0000
   -0.0002    0.0000
    0.0000    0.0001
    0.0009    0.0005
    0.0030    0.0014
    0.0074    0.0030
    0.0148    0.0058
    0.0255    0.0097
    0.0392    0.0148
    0.0546    0.0205
    0.0695    0.0261
    0.0813    0.0305
    0.0877    0.0329
    0.0871    0.0327
    0.0796    0.0299
    0.0670    0.0251
    0.0521    0.0195
    0.0378    0.0141
    0.0260    0.0096
    0.0172    0.0062
    0.0111    0.0039
    0.0071    0.0024
    0.0043    0.0014
    0.0025    0.0008
    0.0014    0.0004
    0.0007    0.0002
    0.0003    0.0001
    0.0001    0.0000
- surf als Flaeche
figure
surf(X,Y,Z);
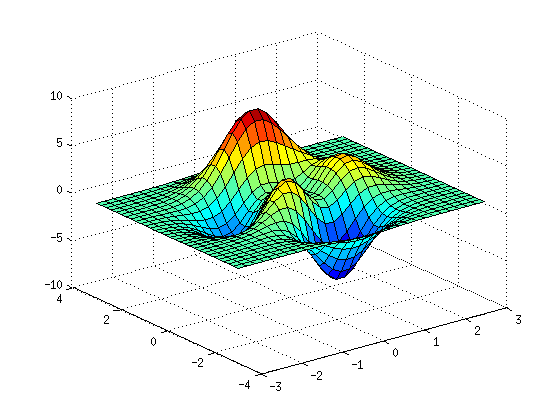
figure
surf(X,Y,Z);
shading interp