Contents
Funktionen Teil I
close all
set(0,'DefaultLineLineWidth',2)
set(0,'DefaultLineMarkerSize',10)
set(0,'DefaultAxesFontSize',24)
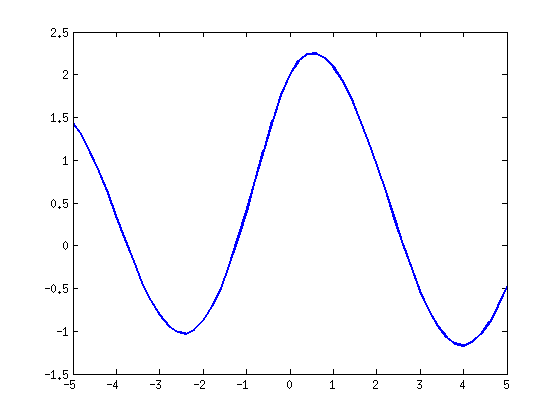
t=-5:0.2:5;
plot(t,sin(t)+cos(t)+1./sqrt(1+t.^2))
Inline Objekte
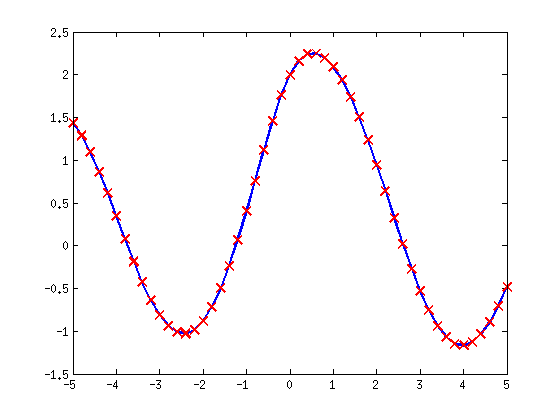
fun = inline('sin(t)+cos(t)+1./sqrt(1+t.^2)')

fun(0)
hold on
plot(t,fun(t),'rx')

bfun = inline('sin(n*x)')

afun = inline('sin(n*x)','x','n')
bfun(1,2)
bfun(1,2) - afun(2,1)

char(fun)
argnames(fun)
formula(fun)
fun =

     Inline function:
     fun(t) = sin(t)+cos(t)+1./sqrt(1+t.^2)


ans =

     2


bfun =

     Inline function:
     bfun(n,x) = sin(n*x)


afun =

     Inline function:
     afun(x,n) = sin(n*x)


ans =

    0.9093


ans =

     0


ans =

sin(t)+cos(t)+1./sqrt(1+t.^2)


ans =

    't'


ans =

sin(t)+cos(t)+1./sqrt(1+t.^2)
@ funtion handle
ermoeglicht -die Verkettung von Funktionen
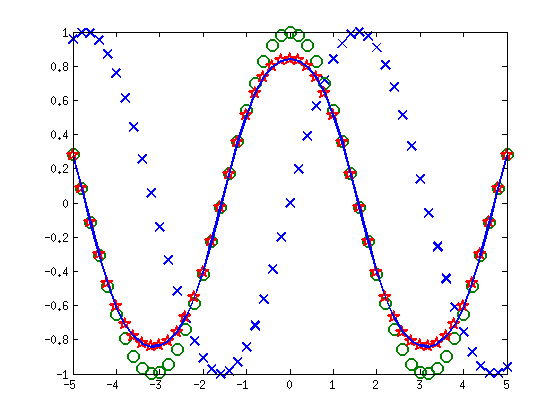
f = @(x) sin(x);
g = @(x) cos(x);
gf = @(x) f(g(x)); % Verkettung von Funktionen
figure
plot(t,f(t),'x',t,g(t),'o',t,gf(t),'p')
hold on
plot(t,sin(cos(t)))
mehrere Argumente
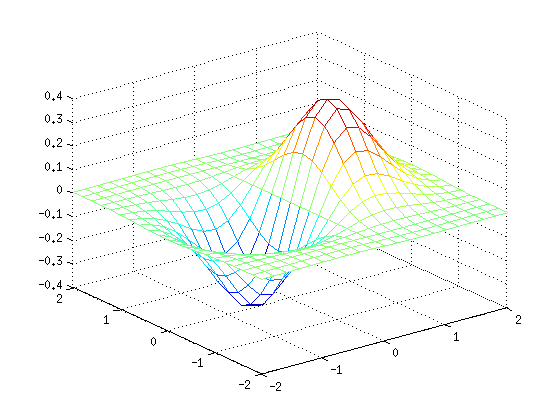
figure
h = @(x,y) sin(x).*cos(y).*exp(-x.^2-y.^2);
[xx,yy]=ndgrid([-2:0.2:2],[-2:0.2:2]);
mesh(xx,yy,h(xx,yy))
isa(h,'function_handle')
ans =

     1
A = [1 2 4]
B = [-1 4 7]

AxpBy = @(x,y) A*x + B*y;

AxpBy(1,1)

A = [-2 3 7]

AxpBy(1,1)
AxpBy = @(x,y) A*x + B*y;
AxpBy(1,1)
A =

     1     2     4


B =

    -1     4     7


ans =

     0     6    11


A =

    -2     3     7


ans =

     0     6    11


ans =

    -3     7    14